
Instagram stands among the most popular social media platforms today. Many professionals use it to promote their businesses, showcase portfolios, blog, and create diverse types of content. With millions of users across various niches, Instagram continually evolves to enhance the experience for both content creators and audiences. However, these constant changes can significantly impact the reach of posts, which in turn affects long-term performance. For creators aiming to sustain success, analyzing Instagram reach data becomes essential — and this is where Data Science plays a crucial role in social media.
In this article, we’ll explore Instagram Reach Analysis using Python, providing content creators with insights to better adapt to Instagram’s evolving landscape over the long term. You can download the dataset from here for your reference.
Data Exploration
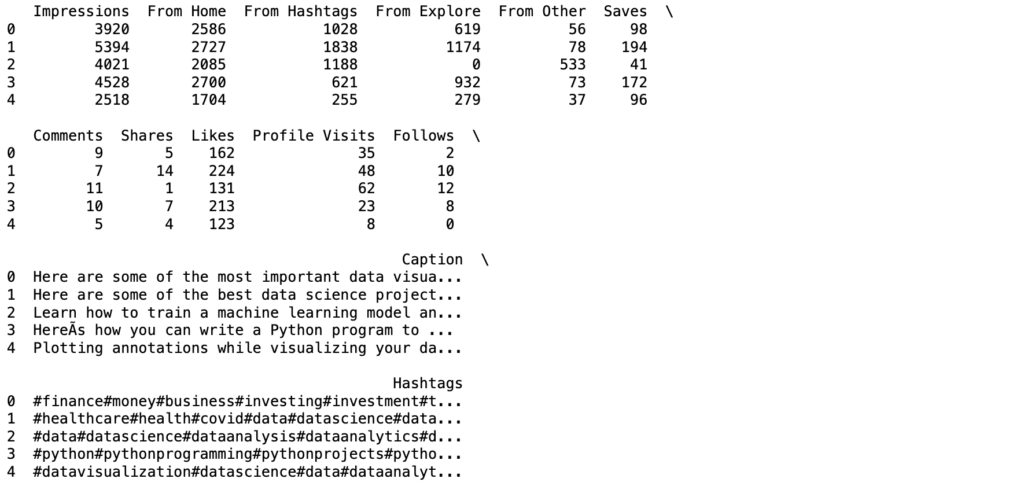
We’ll begin analyzing the reach of my Instagram account by importing the required Python libraries and loading the dataset.
import pandas as pd
import numpy as np
import matplotlib.pyplot as plt
import seaborn as sns
import plotly.express as px
from wordcloud import WordCloud, STOPWORDS, ImageColorGenerator
from sklearn.model_selection import train_test_split
from sklearn.linear_model import PassiveAggressiveRegressor

data=pd.read_csv("/Users/rahul_anand/Downloads/instagram.csv", encoding="windows-1252")
print(data.head())
Before proceeding, let’s first check if this dataset contains any null values.
data.isnull().sum()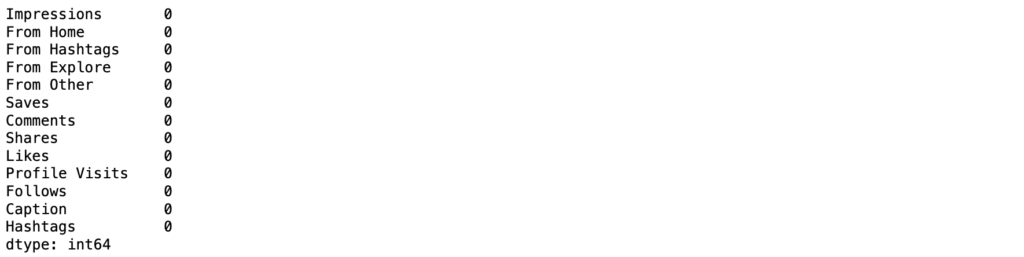
So it has no null value. Everything fine. Let’s proceed to the next step.
Let’s review the column details to understand the data types of each one:
data.info()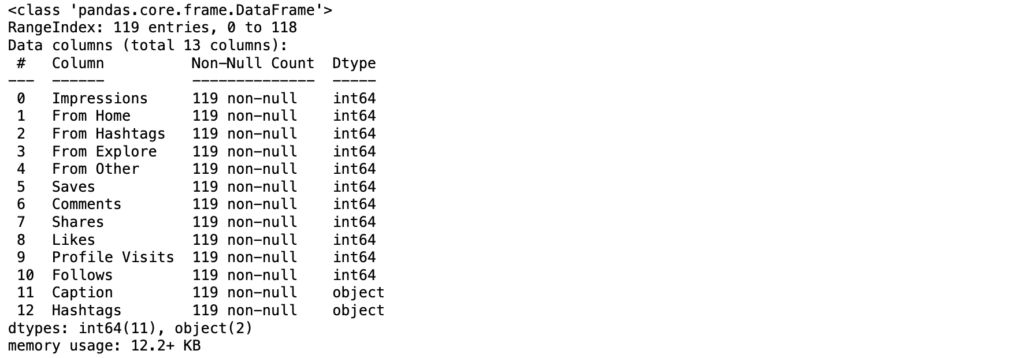
Analyzing Instagram Reach
Let’s begin by examining the reach of my Instagram posts, starting with the distribution of impressions generated from the Home section.
plt.figure(figsize=(10, 8))
plt.style.use('fivethirtyeight')
plt.title("Distribution of Impressions From Home")
sns.distplot(data['From Home'])
plt.show()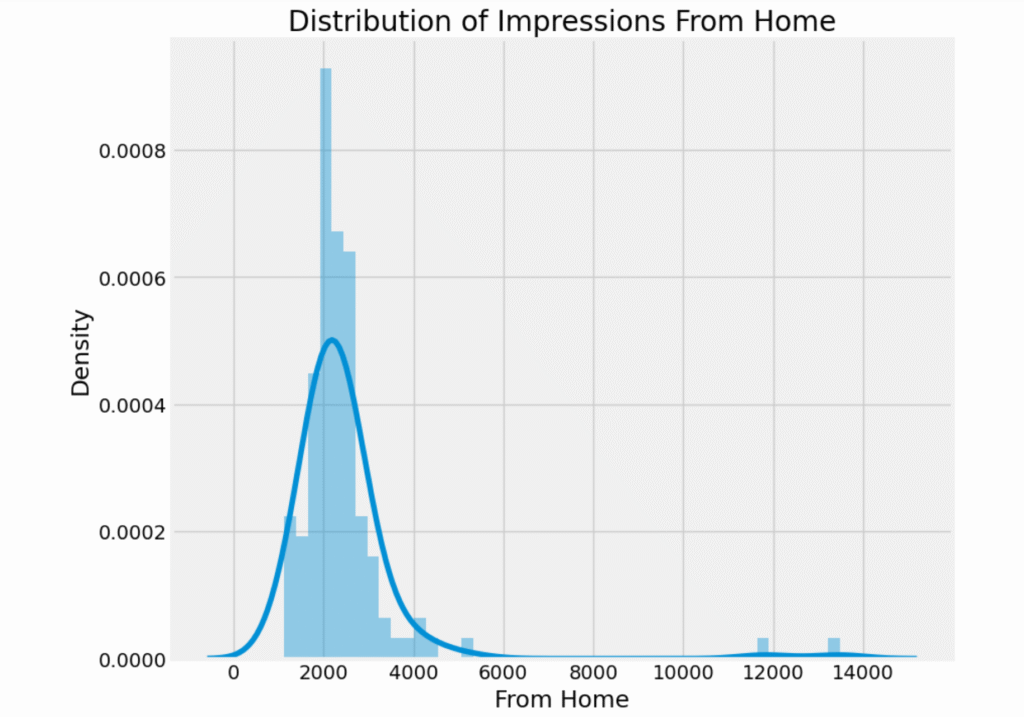
Key Observations:
- The distribution is right-skewed (positively skewed).
- Most posts receive impressions in a relatively narrow range, but a few outliers have extremely high impressions.
- The majority of impressions are centered around 1,500 to 3,000.
- The peak (mode) is close to ~2,000 impressions, indicating that’s the most common range.
- There are a few posts with exceptionally high impressions (above 6,000 and even above 12,000).
- These are likely viral posts or boosted posts.
- While most values fall in a tight range, the long tail suggests a small number of posts gain significantly more visibility from the Home section.
Interpretation
- Your typical reach from the Home section is fairly consistent.
- However, certain posts have broken through and reached a much wider audience, likely due to higher engagement or algorithmic promotion.
- This suggests a baseline performance level, with occasional spikes.
Let’s look at the distribution of the impressions received from hashtags
plt.figure(figsize=(10, 8))
plt.style.use('fivethirtyeight')
plt.title("Distribution of Impressions From Hashtags")
sns.distplot(data['From Hashtags'])
plt.show()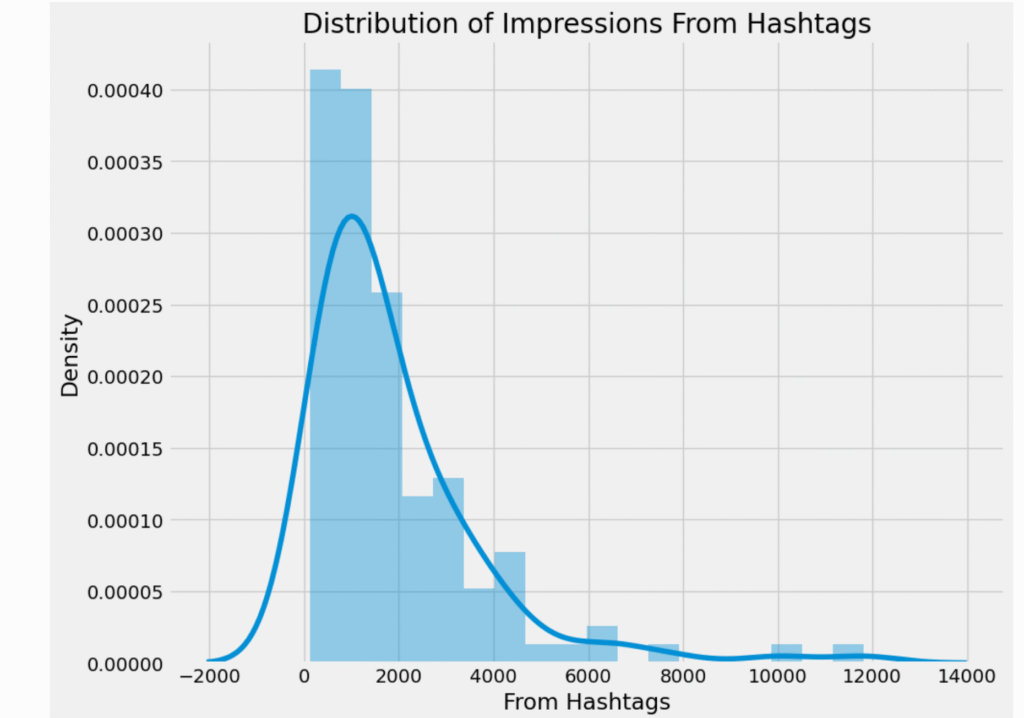
Key Observations
- The distribution is heavily right-skewed (long tail on the right).
- Most posts get a modest number of impressions from hashtags, but a few posts achieve significantly higher results.
- The majority of impressions fall between 0 and ~2,500.
- The peak (mode) appears just under 1,000 impressions, meaning that’s the most common performance range from hashtags.
- Several posts received exceptionally high hashtag impressions (above 6,000, with some reaching 10,000–12,000).
- These likely correspond to posts that ranked well in hashtag search or gained extra engagement momentum.
- Most data is concentrated in the lower range, but the wide tail suggests the potential for hashtags to deliver huge spikes when used effectively.
Interpretation
- Hashtags generally contribute a moderate, consistent level of impressions.
- Occasionally, they drive massive reach — indicating that a well-targeted or trending hashtag strategy can dramatically boost exposure.
- Optimizing hashtag relevance and experimenting with trending tags could help replicate these spikes more often.
Let’s look at the distribution of impressions received from the explore section of Instagram:
plt.figure(figsize=(10, 8))
plt.title("Distribution of Impressions From Explore")
sns.distplot(data['From Explore'])
plt.show()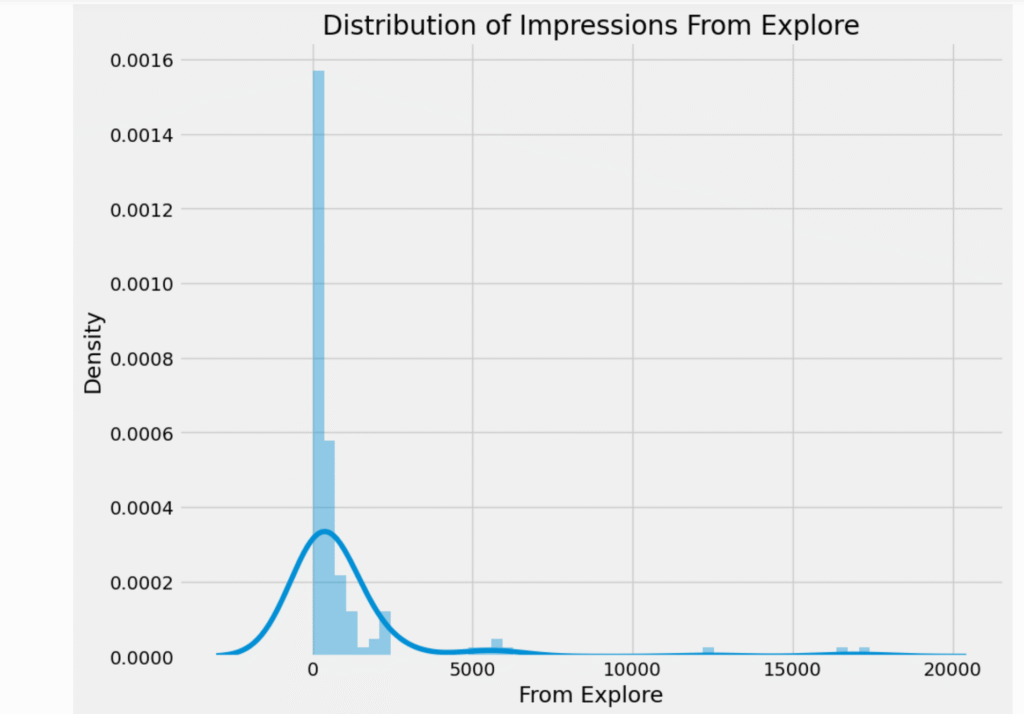
Key Observations
- The distribution is heavily right-skewed with a sharp peak near zero.
- Most posts get very few impressions from Explore, with only a small percentage gaining high visibility.
- The majority of impressions from Explore are under 1,000.
- Many posts likely receive close to zero Explore impressions, indicating they didn’t get picked up by Instagram’s recommendation algorithm.
- There are a few extreme outliers with impressions reaching 5,000 to 20,000.
- These are likely posts that performed exceptionally well in engagement and were shown widely on Explore.
- Most values are tightly packed at the low end, but the long tail shows Explore’s potential to deliver massive exposure when a post gains traction.
Interpretation
- Baseline performance from Explore is low — meaning Explore isn’t consistently a major source of impressions.
- However, the occasional spikes are significant, suggesting that if a post gets enough engagement early, Explore can amplify its reach dramatically.
- Content optimized for high engagement (eye-catching visuals, trending topics, engaging captions) could help increase these spikes.
Now, let’s have a look at the percentage of impressions from various sources on Instagram:
home=data["From Home"].sum()
hastags=data["From Hashtags"].sum()
explore=data["From Explore"].sum()
other=data["From Other"].sum()

labels=['From Home', 'From Hashtags', 'From Explore', 'Other']
values=[home, hastags, explore, other]

fig=px.pie(data, values=values, names=labels,
          title='Impressions on Instagram Posts From Various Sources')
fig.show()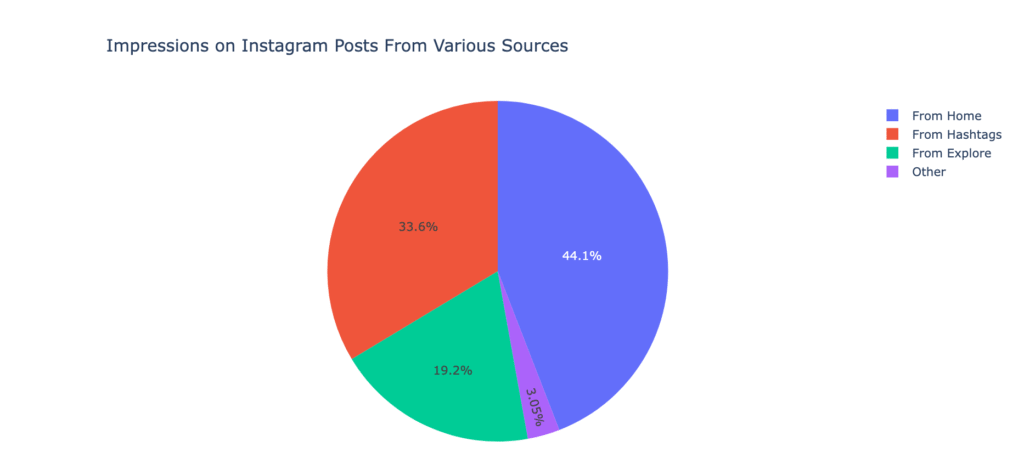
Key Observations
- The largest portion of impressions comes from the Home feed.
- This indicates your followers (or people who see your posts via their feed) are the main drivers of reach.
- Maintaining follower engagement is crucial to sustain this percentage.
- Hashtags are the second-biggest source, contributing about one-third of total impressions.
- This suggests your hashtag strategy is already working well, but refining it could increase exposure further.
- Explore contributes nearly one-fifth of impressions.
- While smaller than Home and Hashtags, Explore has high viral potential, as seen in earlier distributions where some posts spiked massively.
- A small fraction comes from other sources (profile visits, shares, tags, etc.).
- While this is minor, improving profile visibility and encouraging shares could help boost it.
Interpretation
- Your core audience (Home) drives consistent reach.
- Hashtags are your main growth lever for reaching non-followers.
- Explore is your wildcard — not consistent, but capable of generating large reach when a post gains traction.
- Balancing engagement for followers while experimenting with hashtags and content styles that appeal to Explore could yield the best overall growth.
Content Analysis
Now, let’s analyse the content of Instagram posts. The dataset contains two key columns — caption and hashtags — which will help us understand the themes and topics I typically share. To start, we’ll generate a word cloud from the caption column to visualize the most frequently used words in my post captions.
text=" ".join(i for i in data.Caption)
stopwords=set(STOPWORDS)
wordcloud=WordCloud(stopwords=stopwords, background_color="white").generate(text)
plt.style.use('classic')
plt.figure(figsize=(12, 10))
plt.imshow(wordcloud, interpolation='bilinear')
plt.axis("off")
plt.show()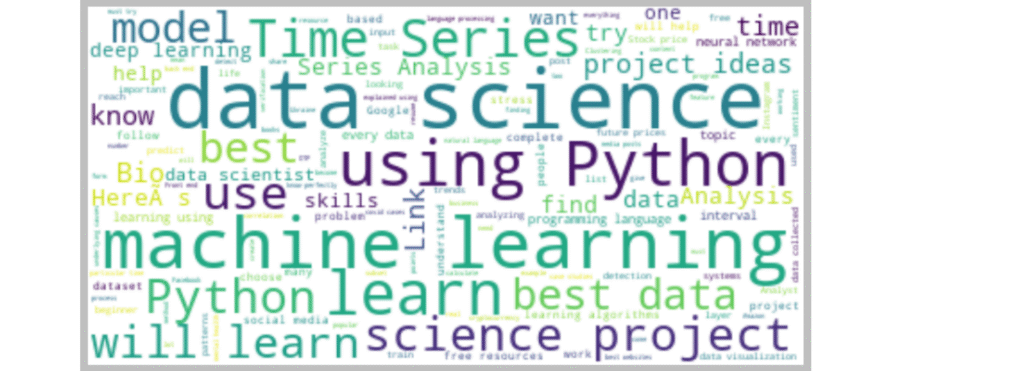
Let’s generate a word cloud from the hashtags column to visualize the most frequently used hashtags in my Instagram posts.
text=" ".join(i for i in data.Hashtags)
stopwords=set(STOPWORDS)
wordcloud=WordCloud(stopwords=stopwords, background_color="white").generate(text)
plt.figure(figsize=(12,10))
plt.imshow(wordcloud, interpolation='bilinear')
plt.axis("off")
plt.show()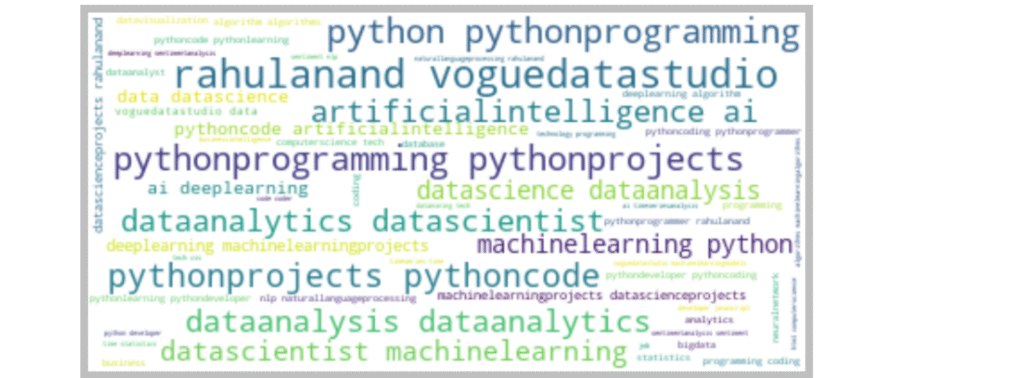
Metrics Relation Analysis
Now, let’s analyze the relationships between different metrics to identify the key factors driving our Instagram reach. This analysis will also give us insights into how the Instagram algorithm may be influencing visibility.
We’ll start by exploring the relationship between the number of likes and the number of impressions on my posts:
figure=px.scatter(data_frame=data, x="Impressions",
                 y="Likes", size="Likes", trendline="ols",
                 title="Relationship Between Likes and Impressions")
figure.show()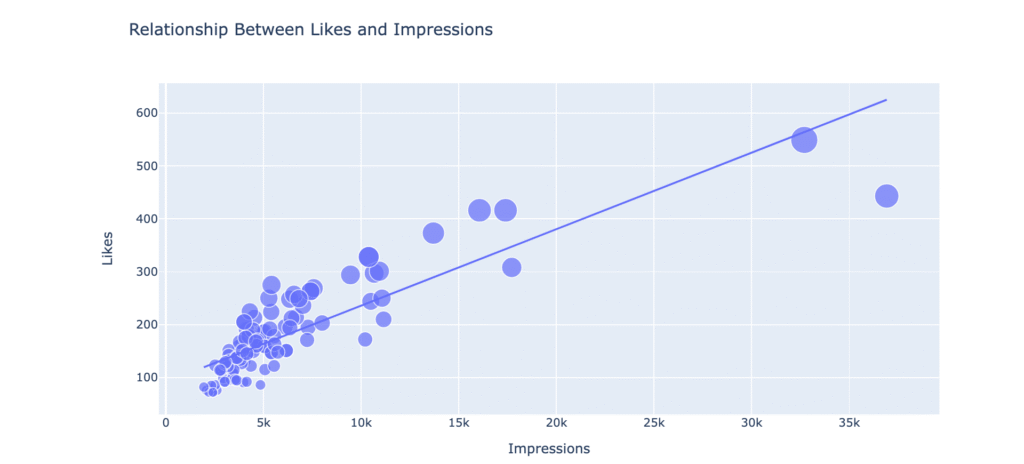
Key Observations
- There is a clear upward trend: posts with more impressions tend to receive more likes.
- This suggests that likes scale proportionally with reach — as more people see your posts, more of them engage.
- The data points are fairly close to the trend line, indicating a strong correlation between likes and impressions.
- This means likes are a reliable predictor of impressions (and possibly vice versa).
- Most posts fall within 2k–8k impressions and 100–300 likes.
- A few high-performing posts (outliers) go beyond 20k impressions and 400+ likes — these likely benefited from extra exposure via Explore or viral hashtag performance.
- Since likes are positively linked to impressions, posts that get a high number of likes early might trigger Instagram’s algorithm to push them to more feeds and Explore.
- Encouraging early engagement (e.g., through captions that invite interaction) could help amplify reach.
Let’s now analyze the number of comments correlates with the number of impressions on my Instagram posts.
figure=px.scatter(data_frame=data, x="Impressions",
                 y="Comments", size="Comments", trendline="ols",
                 title="Relationship Between Comments and Total Impressions")
figure.show()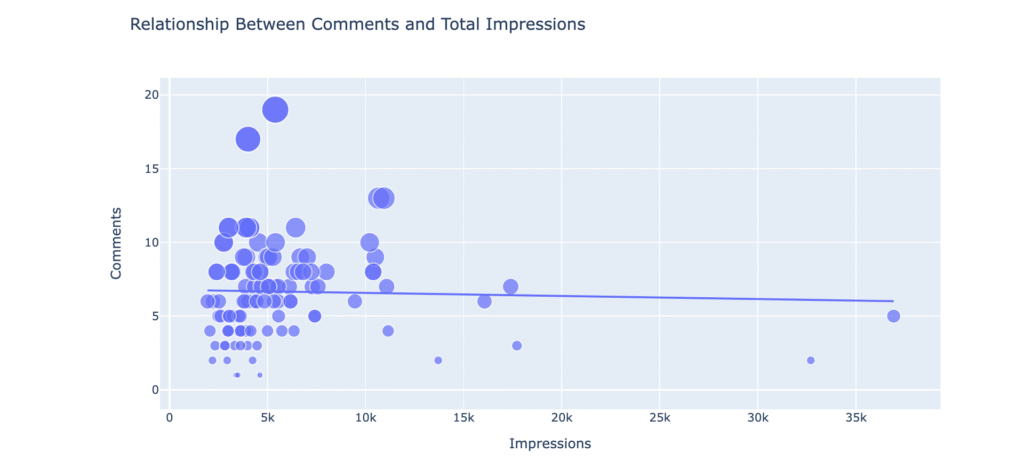
Key observations:
- The regression line is slightly sloping downward, suggesting a weak negative correlation between impressions and comments. This implies that posts with higher impressions do not necessarily attract more comments — in fact, there’s a slight tendency for them to have fewer comments on average.
- Most posts fall within the range of 0–10k impressions and 0–12 comments.
- A few posts have very high impressions (over 30k) but comparatively low comment counts, which might be lowering the slope of the regression line.
- The different bubble sizes could represent another metric (possibly likes or reach), indicating that some posts with high engagement in other metrics don’t always get proportional comment activity.
In short, audience might view a post widely without engaging in conversation, or certain posts spark more discussion despite having fewer views.
Let’s now analyze the number of shares relates to the number of impressions.
figure=px.scatter(data_frame=data, x="Impressions", y="Shares",
                  size="Shares", trendline="ols",
                  title="Relationship Between Shares and Total Impressions")
figure.show()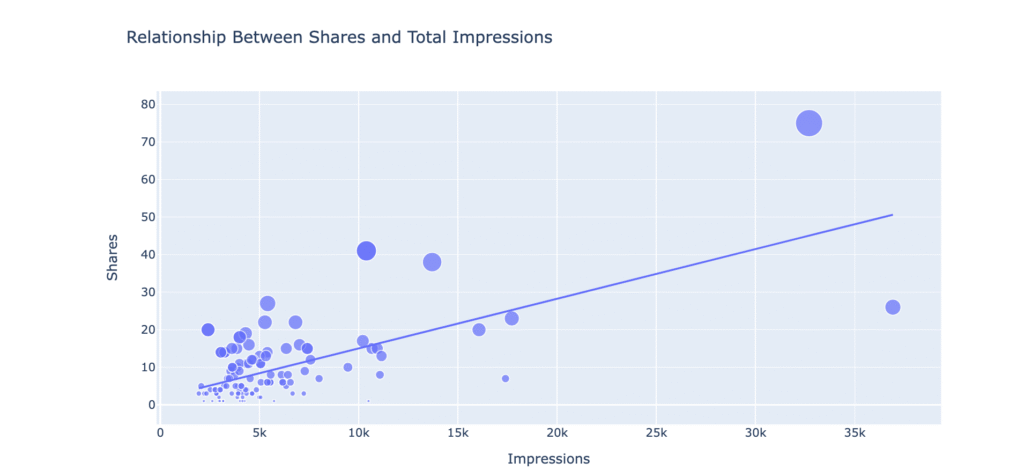
Key observations:
- Positive correlation: The upward slope of the trend line suggests that more impressions tend to be associated with more shares.
- Clustered data: Most points are concentrated at lower impression counts (below ~10k impressions) and fewer shares (below ~20 shares).
- Outliers: There are a few data points with very high impressions (30k–37k) and high shares (up to ~75), which may significantly influence the trend line.
- Bubble size variation: The different bubble sizes likely represent another variable (possibly engagement or reach), with larger bubbles appearing in higher impression and higher share ranges.
- Spread: While the trend is positive, the data is quite spread out, suggesting that shares are influenced by impressions but also by other factors (e.g., content quality, audience targeting).
Let’s analyze the number of saves relates to the number of impressions.
figure=px.scatter(data_frame=data, x="Impressions",
                 y="Saves", size="Saves", trendline="ols",
                 title="Relationship Between Post Saves and Total Impressions")
figure.show()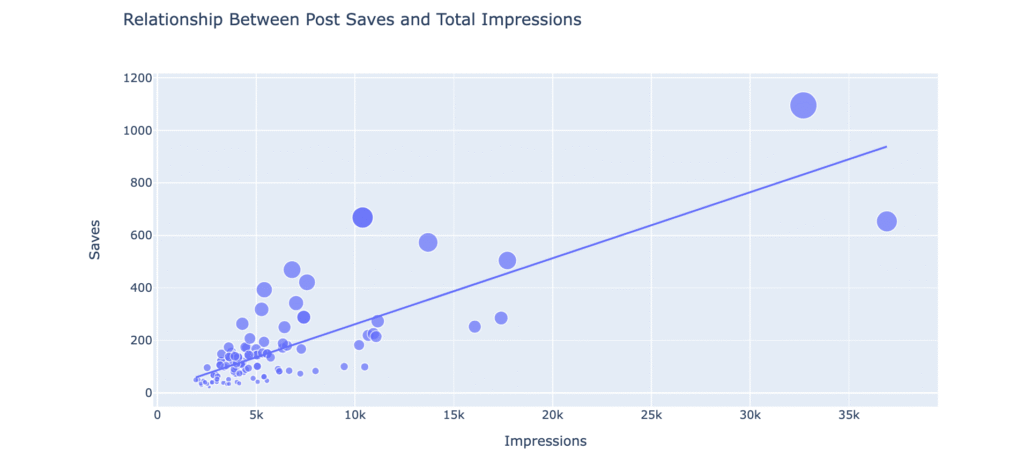
Key observations:
- Positive correlation – The upward-sloping trend line shows that posts with more impressions generally receive more saves.
- Cluster at lower values – Most posts have impressions below 10k and saves below 200, indicating a concentration of lower-performing posts.
- High-value outliers – There are several posts with very high impressions (20k–37k) and high saves (500–1100). These stand out as top performers.
- Increasing returns – The relationship seems somewhat exponential for the higher end: posts with very large impressions tend to have disproportionately high saves.
- Bubble sizes – The largest bubbles (possibly representing more engagement) are typically among the higher impression and higher save posts, suggesting that viral posts tend to perform well across multiple engagement metrics.
In short, more visibility generally translates to more saves, but a few standout posts greatly exceed the typical engagement ratio.
Now let’s look at the correlation of all the columns with the Impressions column:
correlation=data.corr()
print(correlation["Impressions"].sort_values(ascending=False))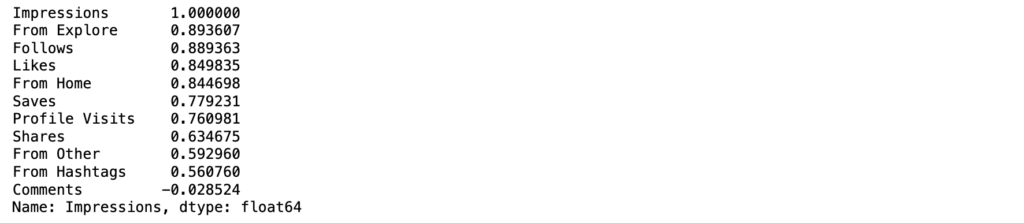
Key Insights
- From Explore (0.894) and Follows (0.889) have the strongest correlations with impressions, meaning posts discovered through the Explore page and posts that attract new followers tend to also have high impressions.
- Likes (0.850) and From Home (0.845) are also highly correlated, suggesting that home feed visibility and engagement go hand in hand with impressions.
- Saves are strongly correlated with impressions, which aligns with the scatter plot you showed earlier. However, it’s slightly weaker than likes or explore reach, meaning that impressions are influenced more by post discovery and immediate engagement than by long-term saving behavior.
- Profile Visits (0.761) and Shares (0.635) also matter but have a smaller impact compared to discovery and likes.
- From Other (0.593) and From Hashtags (0.561) have a moderate link to impressions, suggesting they play a role but are not the main drivers
- Comments (-0.029) show almost no relationship with impressions, meaning more impressions don’t necessarily result in more comments (and vice versa).
Overall insight: Your impressions are most influenced by where people discover your posts (Explore, Home) and direct engagement actions (likes, follows). Saves do matter but aren’t the top driver. Comments, however, don’t appear to be tied to impressions at all.
Analyze Conversion Rate
Here’s a rewritten version of your text:
On Instagram, the conversion rate measures the percentage of profile visitors who end up following you after viewing a post. It can be calculated using the formula:
Conversion Rate = (Follows / Profile Visits)×100
Let’s calculate the conversion rate:
conversion_rate=(data["Follows"].sum()/data["Profile Visits"].sum())*100
print(conversion_rate)![]()
So, the conversion rate is approximately 41%, which is quite high.
Let’s look at the relationship between the total profile visits and the number of followers gained from all profile visits:
figure=px.scatter(data_frame=data, x="Profile Visits",
                 y="Follows", size="Follows", trendline="ols",
                  title="Relationship Between Profile Visits and Followers Gained")
figure.show()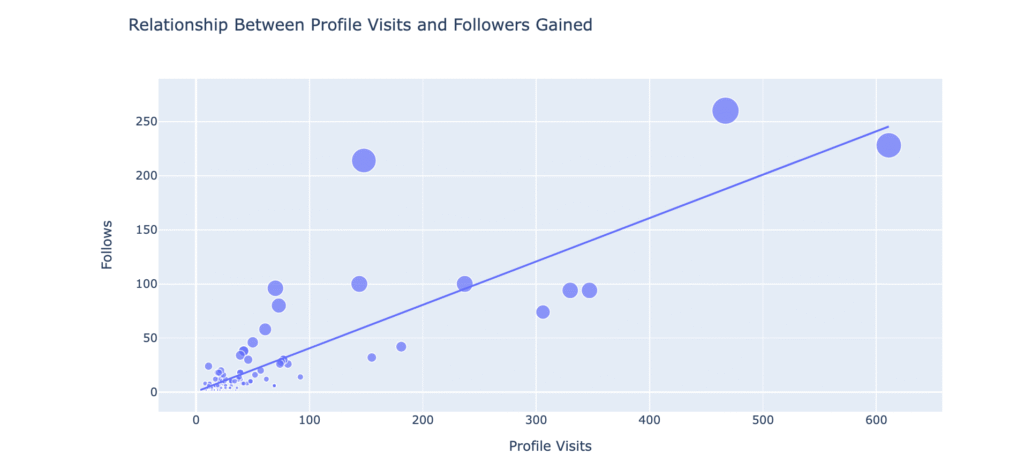
Instagram Reach Prediction Model
In this section, we will train a machine learning model to predict the reach of an Instagram post. Let’s split the data into training and test sets before training the model:
x=np.array(data[['Likes', 'Saves', 'Comments', 'Shares',
                 'Profile Visits', 'Follows']])
y=np.array(data["Impressions"])
xtrain, xtest, ytrain, ytest = train_test_split(x, y,
                                               test_size=0.2,
                                               random_state=42)
Lets train a machine learning model to predict the reach of an Instagram post using Python:
model=PassiveAggressiveRegressor()
model.fit(xtrain, ytrain)
model.score(xtest, ytest)![]()
Let’s now use the machine learning model to predict the reach of an Instagram post based on given inputs.
#Features = [['Likes', 'Saves', 'Comments', 'Shares', 'Profile Visits','Follows']]
features=np.array([[500, 233, 4, 0, 165, 10]])
model.predict(features)![]()
Conclusion
This analysis shows that Home feed is the main driver of impressions, while hashtags and Explore provide growth opportunities, especially when posts gain traction. Engagement metrics like likes, follows, and saves strongly influence reach, with a notable 41% conversion rate from profile visits to followers. Combined with a machine learning prediction model, these insights help in both understanding past performance and forecasting future reach.